
Are Your Reorder Points Set Based on Fiction ?

How many reorder points does your organization carry, and when did anyone last look at one? Every stocked item's record holds one, the stock level at which the system raises a replenishment order, and a large plant or fleet carries tens of thousands of them.
Supply chain sets that number and reviews it. Maintenance carries the consequence of it being wrong, which arrives as hours an asset spends out of service waiting for a part.
So what does the reviewer have in front of them? They have consumption history, which records what maintenance took off the shelf and leaves out what an item's absence costs. The number that decides how long an asset waits is therefore set by a function whose own measures never record the waiting, months before the work order exists.
The consumption record and the review cycle
Amtrak's Office of Inspector General audited the company's maintenance-of-equipment inventory in February 2024. The Supply Chain group "uses historical consumption data to set reorder points," which the report defines as the minimum stock levels that trigger it to reorder an item.
Consumption history is a byproduct of maintenance doing its work, so it also records what people do when the storeroom is unreliable. Of the mechanical employees the auditors spoke with, 40 of 88 said they order larger quantities than they need and store the excess, and 67 of 88 said they take parts from one unit to repair another.
Employees do not always record the second, so the auditors found that "the consumption data do not reflect when employees needed these items." Hoarding and cannibalizing both move the record away from what the work required, which means a reorder point set from that record understates it.
The auditors also found that the Supply Chain group "does not regularly and consistently review and update key inventory attributes" including reorder points and lead times, and that custom reorder points set for many items had not been updated "to ensure that they continue to align with the Mechanical department's evolving needs." Supply Chain officials said the group tries to review these attributes multiple times per year and is not doing so consistently.
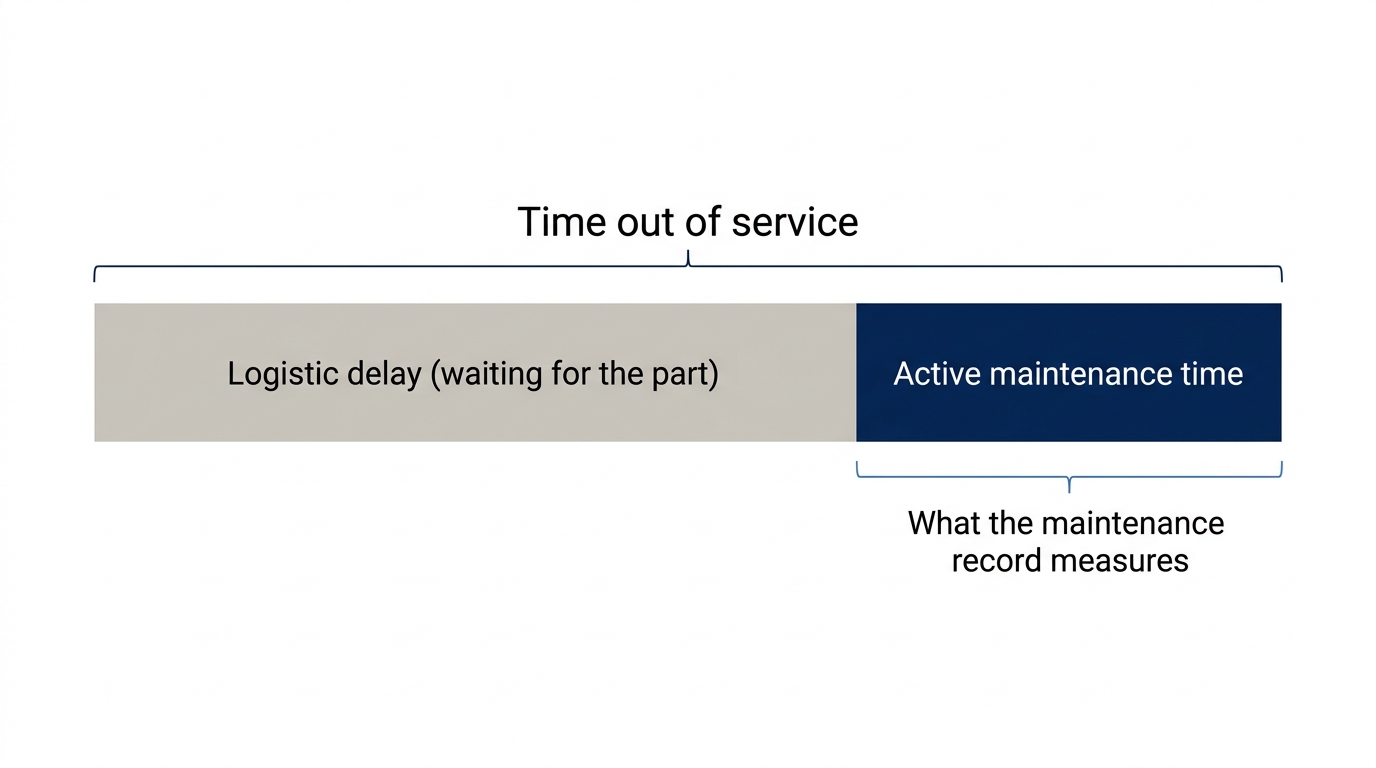
Active maintenance time and logistic delay
The standards separate the waiting from the work. ISO 14224 governs the collection of reliability and maintenance data in the petroleum, petrochemical and natural gas industries, and its 2016 edition, at clause 3.1, defines active maintenance time as the duration of a maintenance action "excluding logistic delay."
The 2006 edition, at clause 3.29, defines logistic delay as "that accumulated time during which maintenance cannot be carried out due to the necessity to acquire maintenance resources," with a note naming "pending arrival of spare parts" among its examples. That wording belongs to the superseded edition, because the 2016 edition harmonizes the term to IEC 60050-192:2015. Either way, the standard records working hours and waiting hours as two quantities, and it names spare parts as a cause of the second.
Measures exist for both quantities. The Society for Maintenance and Reliability Professionals publishes storeroom metrics and downtime metrics in the same body of best practices, and their definitions leave it to each organization whether a storeroom number and a downtime number ever appear on the same page.
A fill rate combined across commodity categories
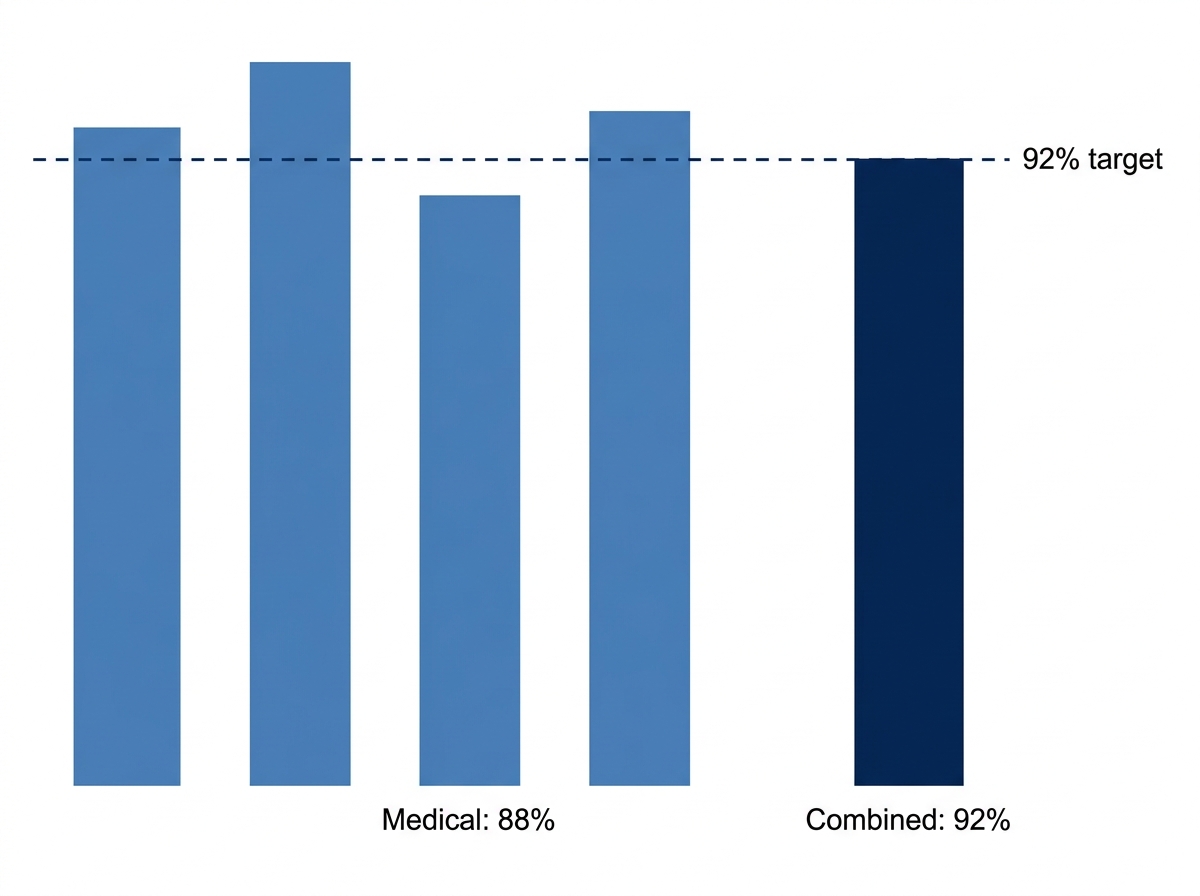
Have you ever checked what a fill rate hides? The UK Ministry of Defence measures its logistics supplier on First Strike Availability, which the National Audit Office describes as measuring "whether Team Leidos holds sufficient stock of a particular item to meet an order from the MoD in full."
The NAO's September 2023 report records that "measurement of performance is combined across all commodity categories, meaning that higher performance in one area can mask lower performance in another." Average First Strike Availability across medical inventory ran at 88% between June 2022 and May 2023 and sat below the 92% contractual target in eight months out of twelve, and the supplier still met its 92% target by improving performance in the procurement of other items.
The NAO is explicit that the supplier performed well to the terms of the contract, and it records that units "have had to proceed without the capability to test for and treat certain medical conditions."
Thirteen thousand unit-days at Amtrak
Can the waiting be counted? Amtrak's auditors put a figure on it, recording that in calendar year 2022 the company "took at least 900 units out of revenue service for a total of approximately 13,000 unit-days while it waited to receive out-of-stock inventory items via expedited shipping."
Footnote 21 to that sentence records that the company "does not track the extent to which it holds units out of revenue service due to unavailable inventory unless they require expedited shipping," so the 13,000 unit-days are the portion of the waiting that became visible because someone had to authorize expedited freight.
The report states that the company "does not measure the operational, customer service, and financial impacts of out-of-stock inventory," and Amtrak's Chief Mechanical Officer told the auditors that the two departments have different inventory-related objectives.
Consequence classification in Norwegian regulation
One regulator has written the link between asset consequence and spare parts into law. Section 46 of Havtil's Activities Regulations requires that facilities' systems and equipment be classified as regards the health, safety and environment consequences of potential functional failures, and that "the classification shall be used as a basis in choosing maintenance activities and maintenance frequencies, in prioritising between different maintenance activities and in evaluating the need for spare parts." The guidance to that section points operators to NORSOK Z-008, and Section 59 of the onshore Technical and Operational Regulations carries the same requirement.
On 19 January 2026 Havtil issued an order to Island Drilling covering the Island Innovator, finding that compliance measurement against Section 46 "has not been performed" and that over 36,000 equipment tags were not classified in respect of safety.
Two rates in US military aviation reporting
One sector reports the two causes of an idle asset separately. The Air Force and the Navy report a not mission capable maintenance rate, which the Government Accountability Office defines as "the percentage of total time when an aircraft is not capable of performing any of its assigned missions due to maintenance," alongside a not mission capable supply rate covering the same percentage "due to the lack of a repair part."
Scoring the maintenance and supply chain pair
The Resonance Score measures a pair of disciplines on a 0 to 5 scale. It scores practice maturity on one side and system enablement on the other, reports the lower of the two as the score, and reports the gap as the Detuning, which shows which side to address first.
The flagship pair is maintenance and reliability, and maintenance and supply chain is not yet a named pair on the Score's roadmap. On the practice side the questions are whether the periodic review of stocking attributes brings the consequence of an item's absence into the reorder point, and whether anyone counts the hours assets spend waiting on parts.
On the system side the question is whether the stocked-item record can see the criticality of the asset the part serves. Octave Attune EAM (formerly Hexagon EAM) holds that record and the materials management capability that sets stock levels against anticipated maintenance demand, and Octave Attune APM holds the criticality and failure-risk view.
The Score is a new instrument and this pair has not been scored. If you want to see where your own organization stands, pull last year's list of assets held out of service waiting on a part, find the reorder point for each part involved, and check the date that number was last changed.
Sources
- Amtrak Office of Inspector General, "Asset Management: Company Has Opportunities to More Effectively Manage and Safeguard Maintenance-of-Equipment Inventory," OIG-A-2024-004, 22 February 2024. amtrakoig.gov
- ISO 14224:2016, "Petroleum, petrochemical and natural gas industries. Collection and exchange of reliability and maintenance data for equipment," clause 3.1. iso.org
- ISO 14224:2006, same title, clause 3.29 (superseded edition). iso.org
- IEC 60050-192:2015, International Electrotechnical Vocabulary, Part 192: Dependability. electropedia.org
- National Audit Office, "Defence inventory management," Ministry of Defence, HC 1793 Session 2022-23, 13 September 2023. nao.org.uk
- Havtil (Norwegian Ocean Industry Authority), the Activities Regulations, Chapter IX Maintenance, Section 46 Classification. havtil.no
- Havtil, Technical and Operational Regulations, Section 59 Classification. havtil.no
- Havtil, "Order to Island Drilling. Island Innovator. Safe operations and maintenance," 19 January 2026. havtil.no
- Standards Norway, NORSOK Z-008:2024, "Risk based maintenance and consequence classification," edition 1.0, 20 December 2024. online.standard.no
- Society for Maintenance and Reliability Professionals, "Best Practices, Metrics & Guidelines," 7th Edition. smrp.org
- U.S. Government Accountability Office, "Air Force and Navy Aviation: Actions Needed to Address Persistent Sustainment Risks," GAO-22-104533, June 2022. gao.gov
- Octave, Attune EAM and Attune APM product pages. octave.com